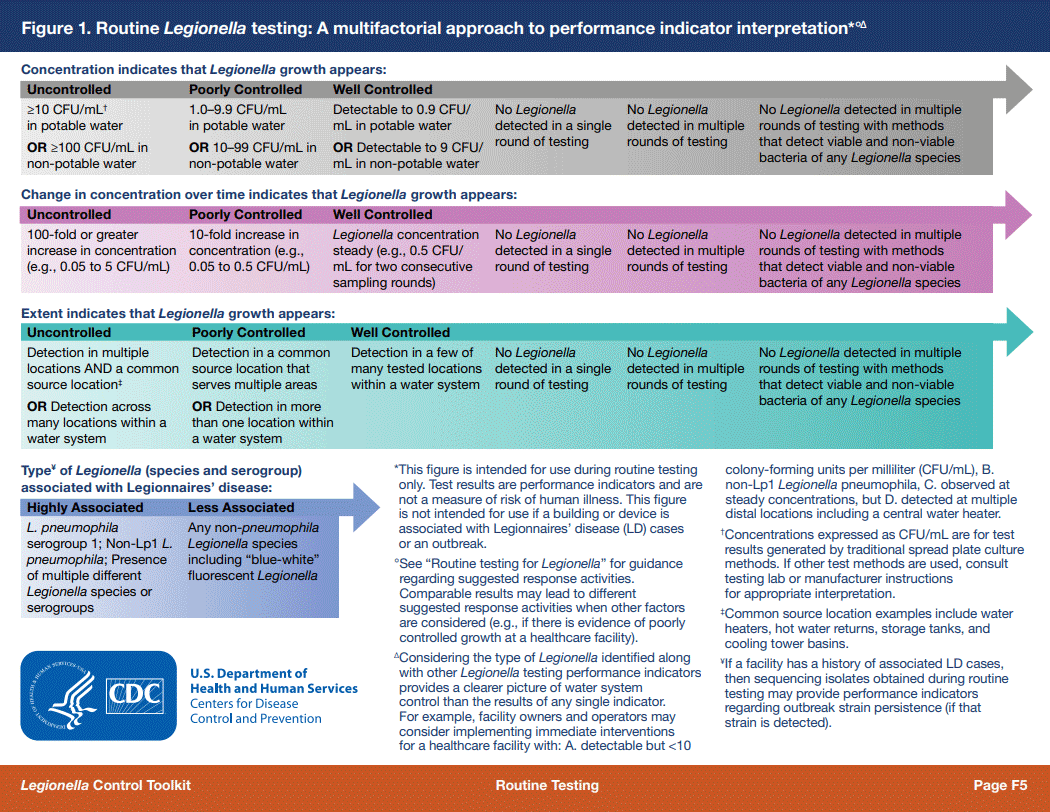
Legionella Testing CDC Chart on Performance Indicators
The CDC has created the chart below entitled, “Routine Legionella testing: A multifactorial approach to performance indicator interpretation.”
The chart has four separate sections that represent different factors of consideration for routine Legionella test results. Below is their description of the chart contents.
The first area relates to the way in which concentration indicates that Legionella growth appears uncontrolled, poorly controlled, or well controlled. Of note, examples are provided along a continuum with a gradient. Concentrations expressed as CFU/mL are for test results generated by traditional spread plate culture methods. If other test methods are used, consult testing lab or manufacturer’s instructions for appropriate interpretation.
The second area relates to the way in which concentration change over time indicates that Legionella growth appears uncontrolled, poorly controlled, or well controlled. Of note, examples are provided along a continuum with a gradient.
The third area relates to the way in which extent of colonization indicates that Legionella growth appears uncontrolled, poorly controlled, or well controlled. Of note, examples are provided along a continuum with a gradient.
The fourth area relates to the way in which type of Legionella, such as species and serogroup, are associated with Legionnaires’ disease. If a facility has a history of associated LD cases, then sequencing isolates obtained during routine testing may provide performance indicators regarding outbreak strain persistence (if that strain is detected.)


